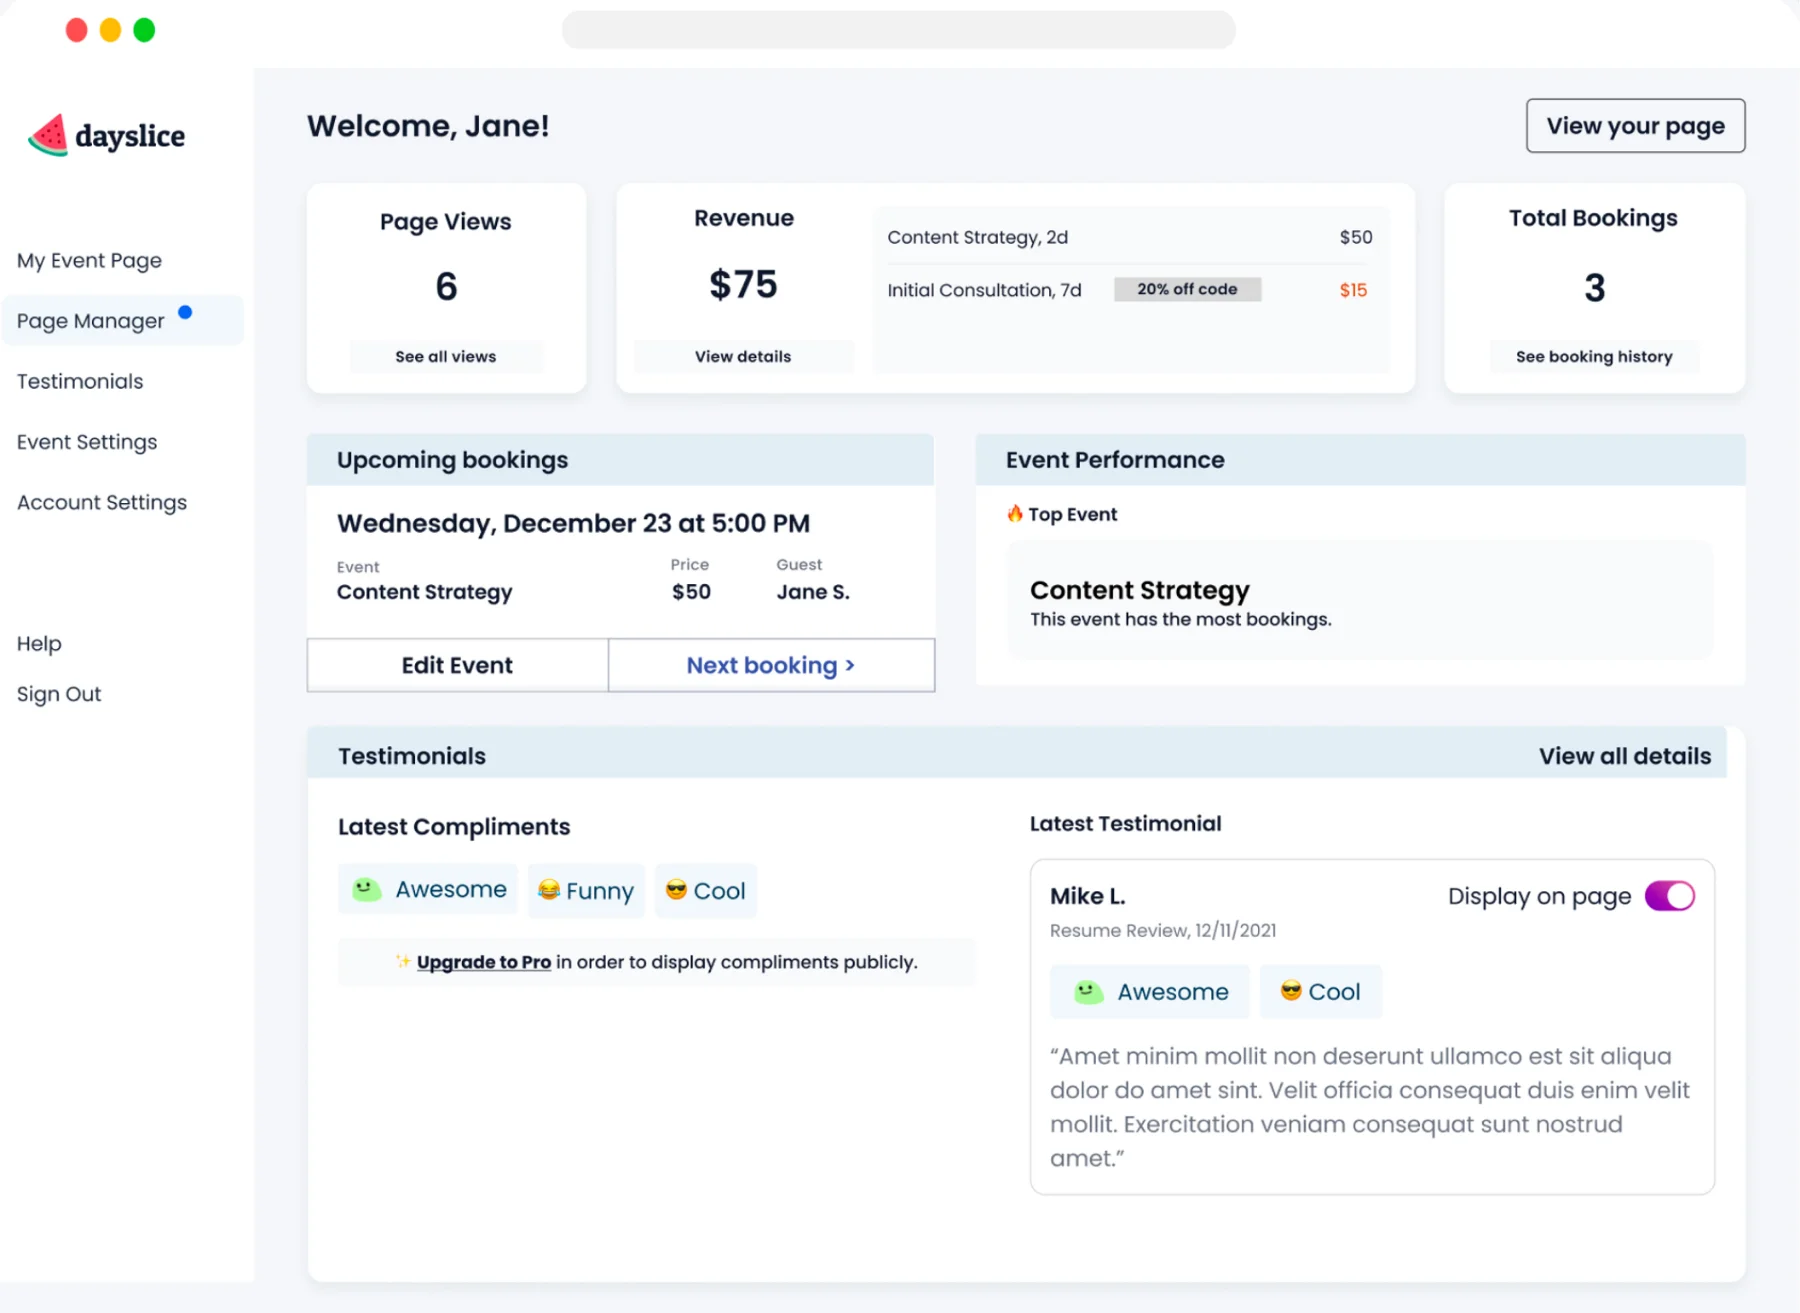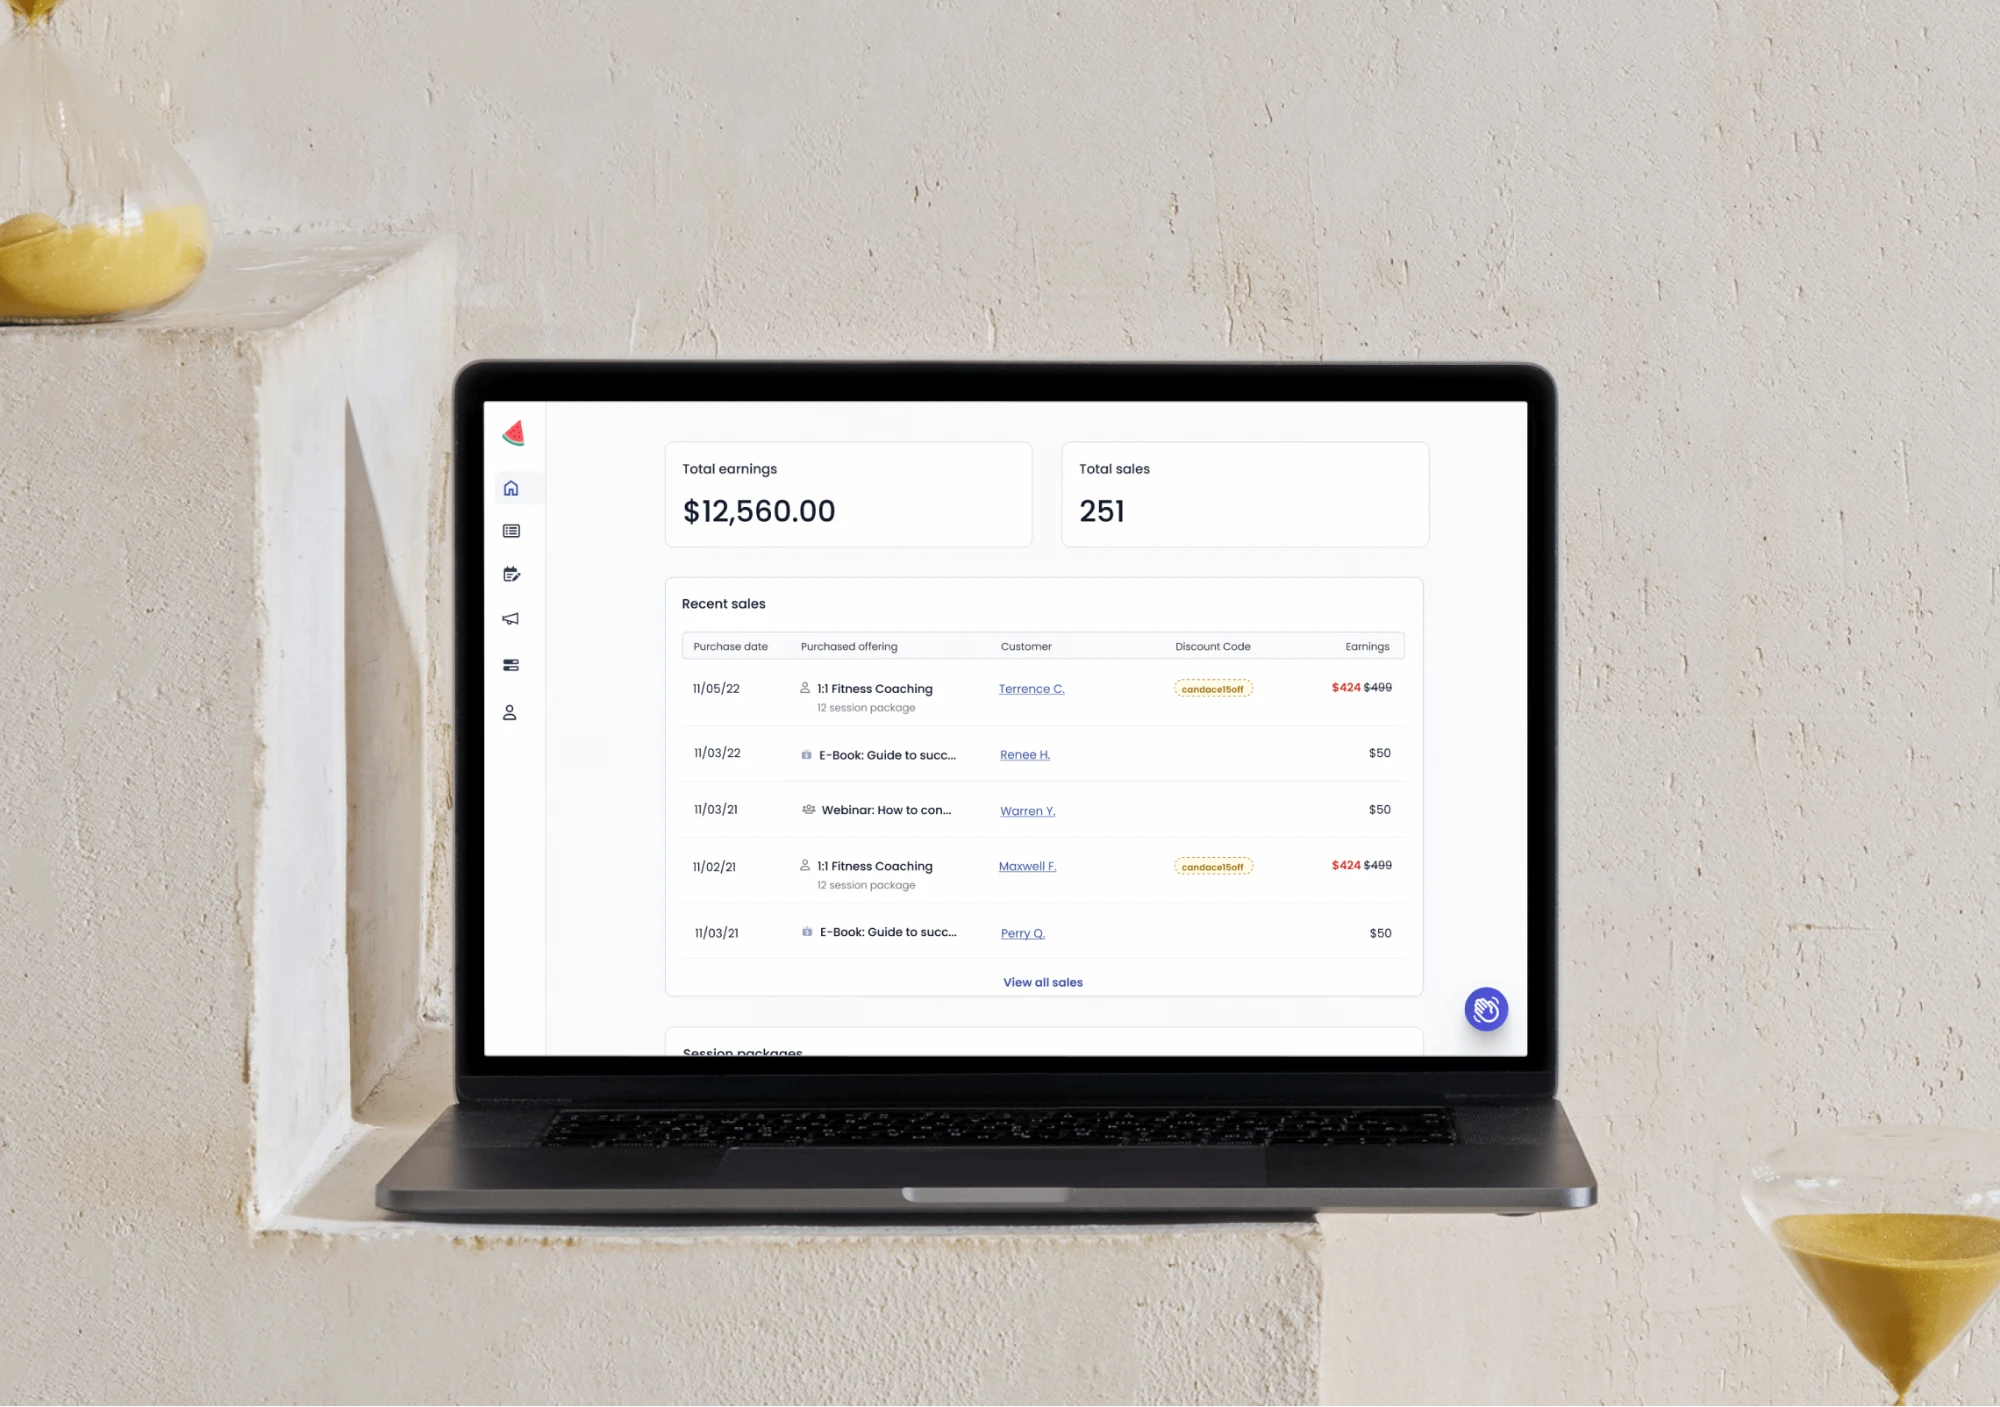
Dayslice dashboard showing total earnings and recent sales
← Back to work

Driving retention and growth for businesses with actionable dashboard insights

Dayslice is a SaaS platform where service businesses can handle bookings, payments, and marketing.

For 4 weeks, I led the entire process for the dashboard project from problem discovery to launch. I worked closely with the team through regular reviews, designed UI concepts for the dashboard view, established a clear information hierarchy, and collaborated with customer success to understand user needs.

Responsibilities

  • UI/UX Design
  • Visual Design
  • Product Design
  • Product Strategy

Team

  • 3 Engineers
  • 1 Head of Marketing
  • 1 Customer Success
  • 1 CEO / Product Manager
The problem

Little data, little incentive

We recognized that users have very little signal as to whether people were interested in their offerings as well as the amount of revenue they’ve made from our product. From a business perspective, we needed to ensure our product stays top-of-mind and provide motive for users to return.
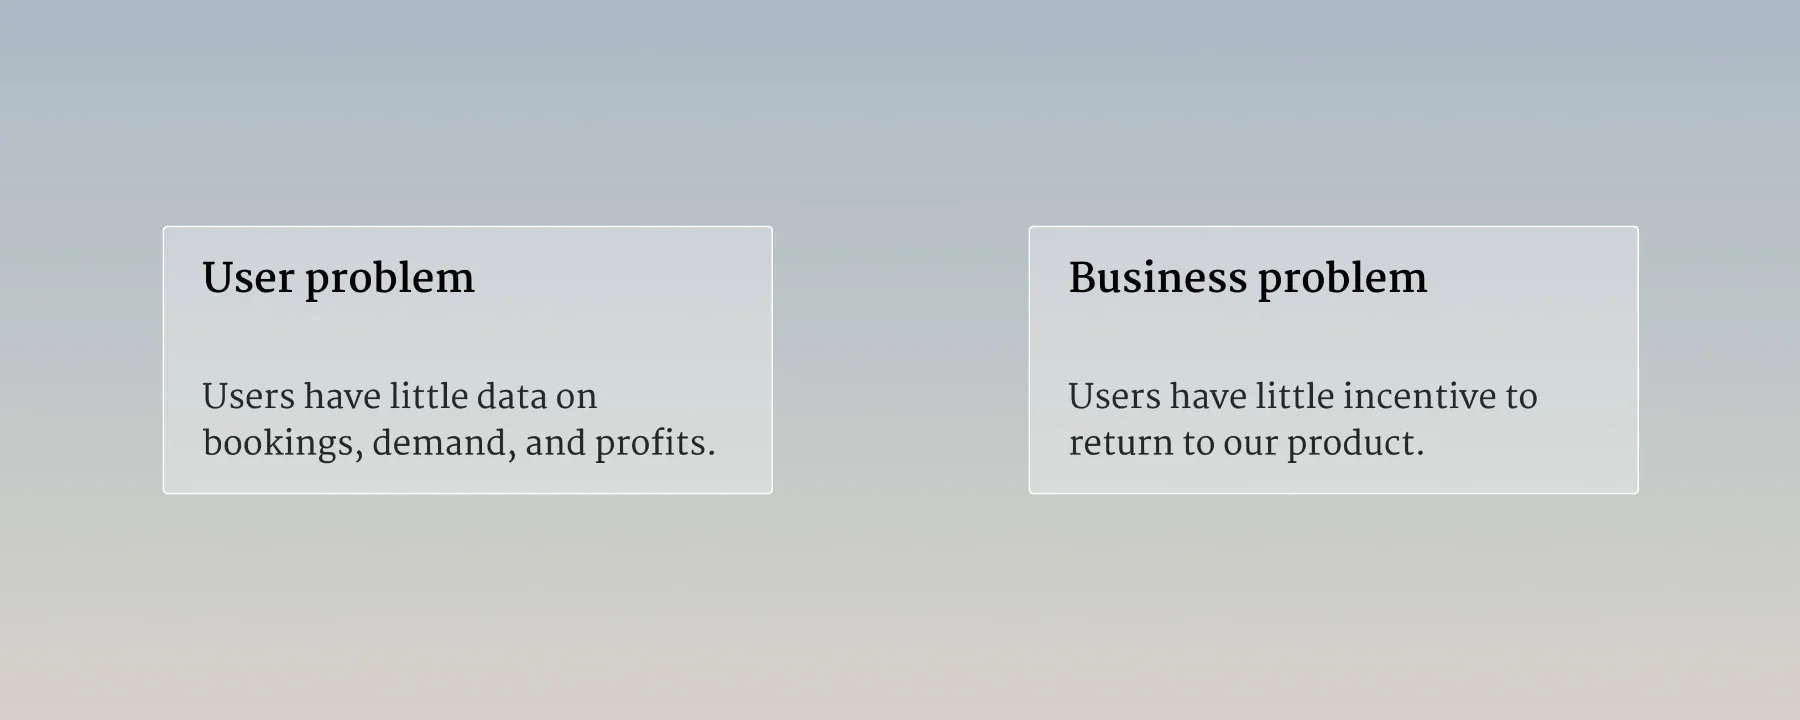
The user problem set beside the business problem

By showing users their metrics and progress, it should help us get customers to return to the product and encourage behaviors to get them moving through the customer journey.

🤔 How can we…

  • Increase user retention on the platform (especially pre-revenue)?
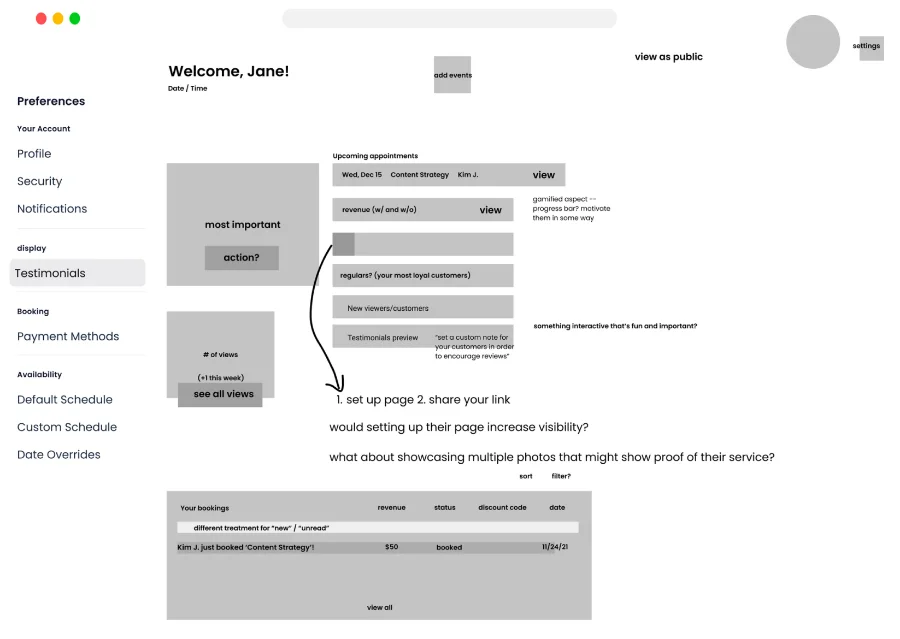
  • Nudge users to set up their page and share their Dayslice link?
  • Help users gain more visibility on their business?
Discovery

Referencing other sources

Searched through resources online for UI/UX ideas for designing a functioning and appealing dashboard.

User feedback from team

To find out whether there’s been any new information from users about our product.

💁 Our users…

  • Are newer to business, side hustlers, early explorers
  • Has made revenue on Dayslice
  • Have pain points of visibility and exposure
  • Need a browsable list of templates to get an idea of what event to create
Ideate

Figuring out hierarchy + how to increase retention/engagement

I also removed some of the more complex ideas to reduce engineering effort, especially since we were hesitant of the cost-benefit.

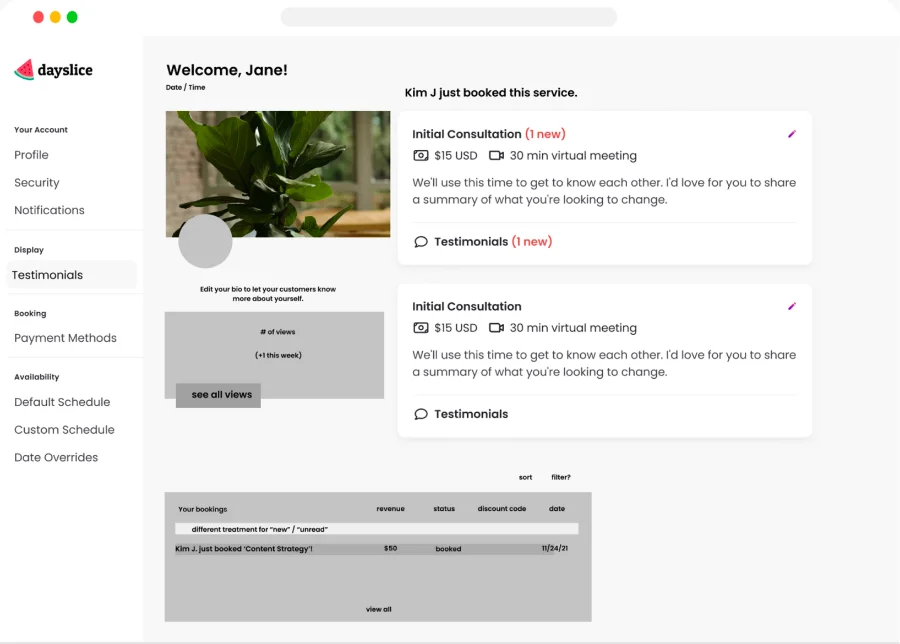
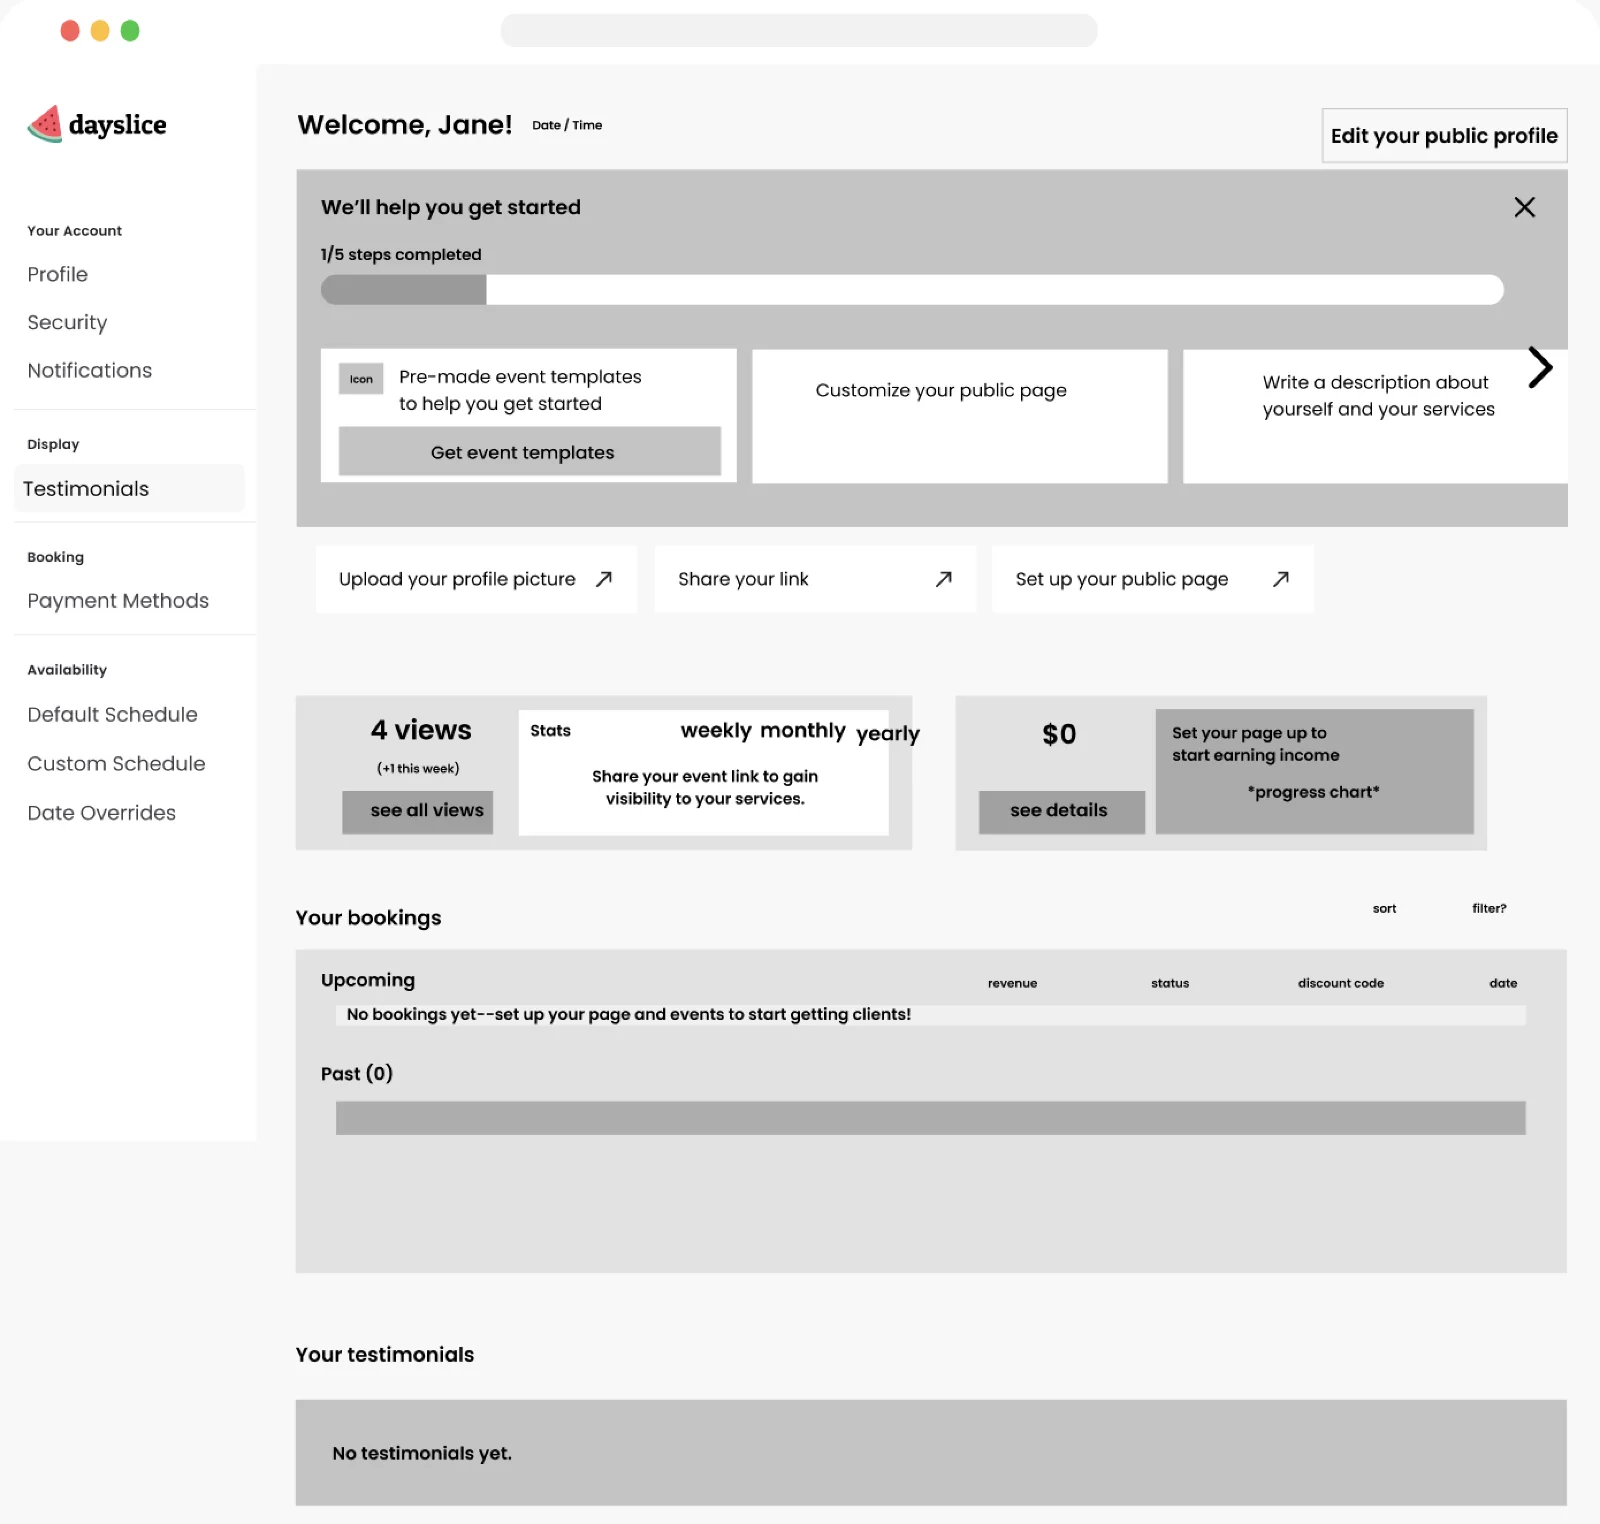
Low-fidelity hierarchy exploration, first direction Low-fidelity hierarchy exploration, second direction

How much onboarding is necessary?

Determining to what extent we should incorporate onboarding along with displaying user insights. Should onboarding be separated? Will this help with our goals?

Exploration of an onboarding checklist alongside the insights

Omitted explorations

These approaches would cause cognitive load, distract users from the main goal, or won’t have the reasonable space to consider future implementations.

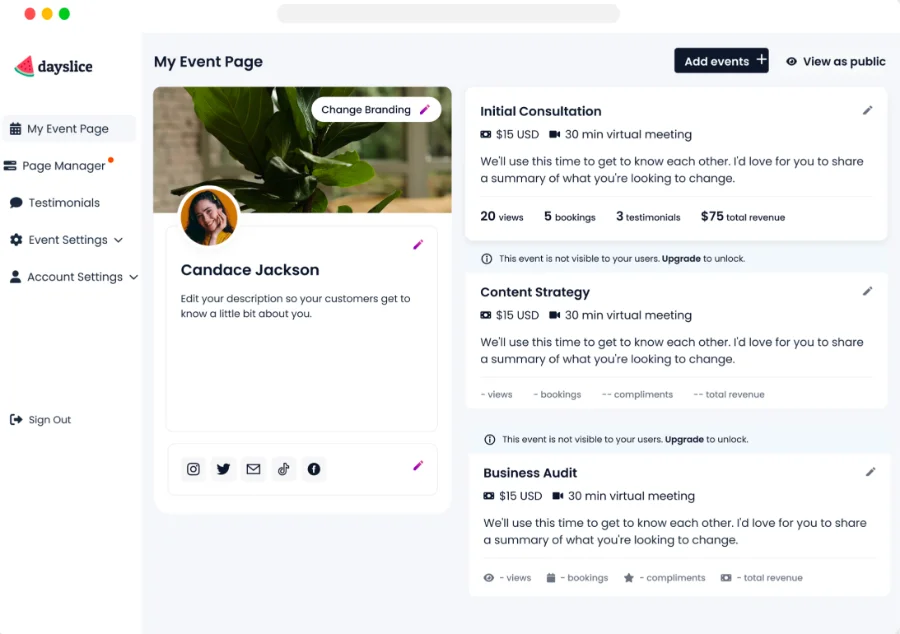
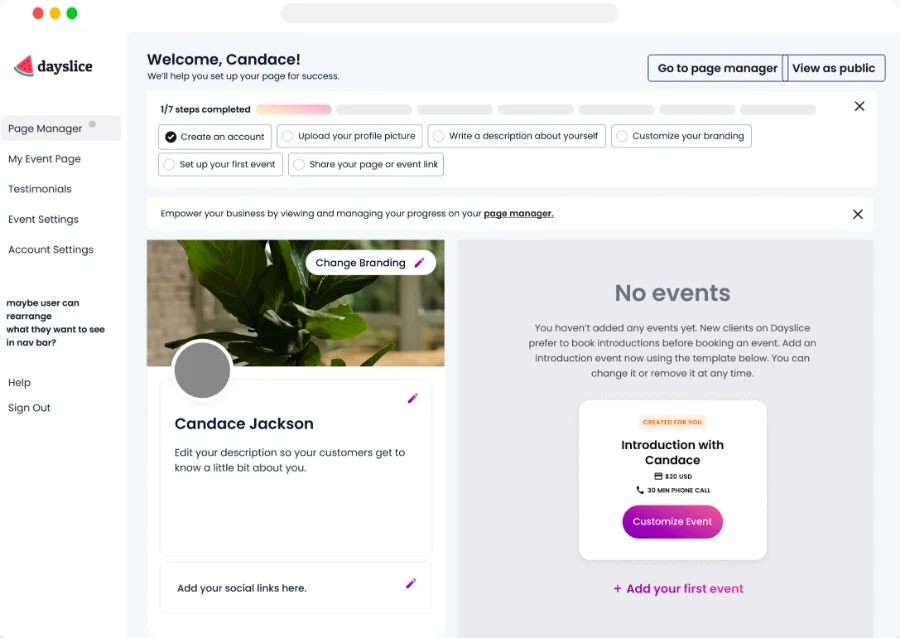
Omitted exploration: insights shown inline on the event page Omitted exploration: onboarding-led empty state

Approaching the right solution

A dedicated page for tracking and managing all insights. This was the most reasonable solution that would meet our goals and has the capacity to include more useful elements in the future.

The chosen direction: a dedicated page for tracking and managing insights
Final design

Considering cost-benefits + engineering effort

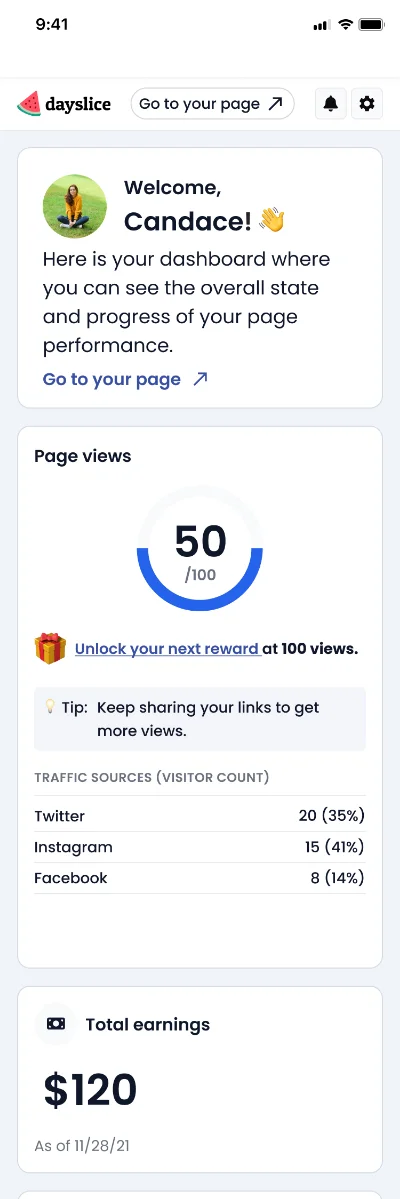
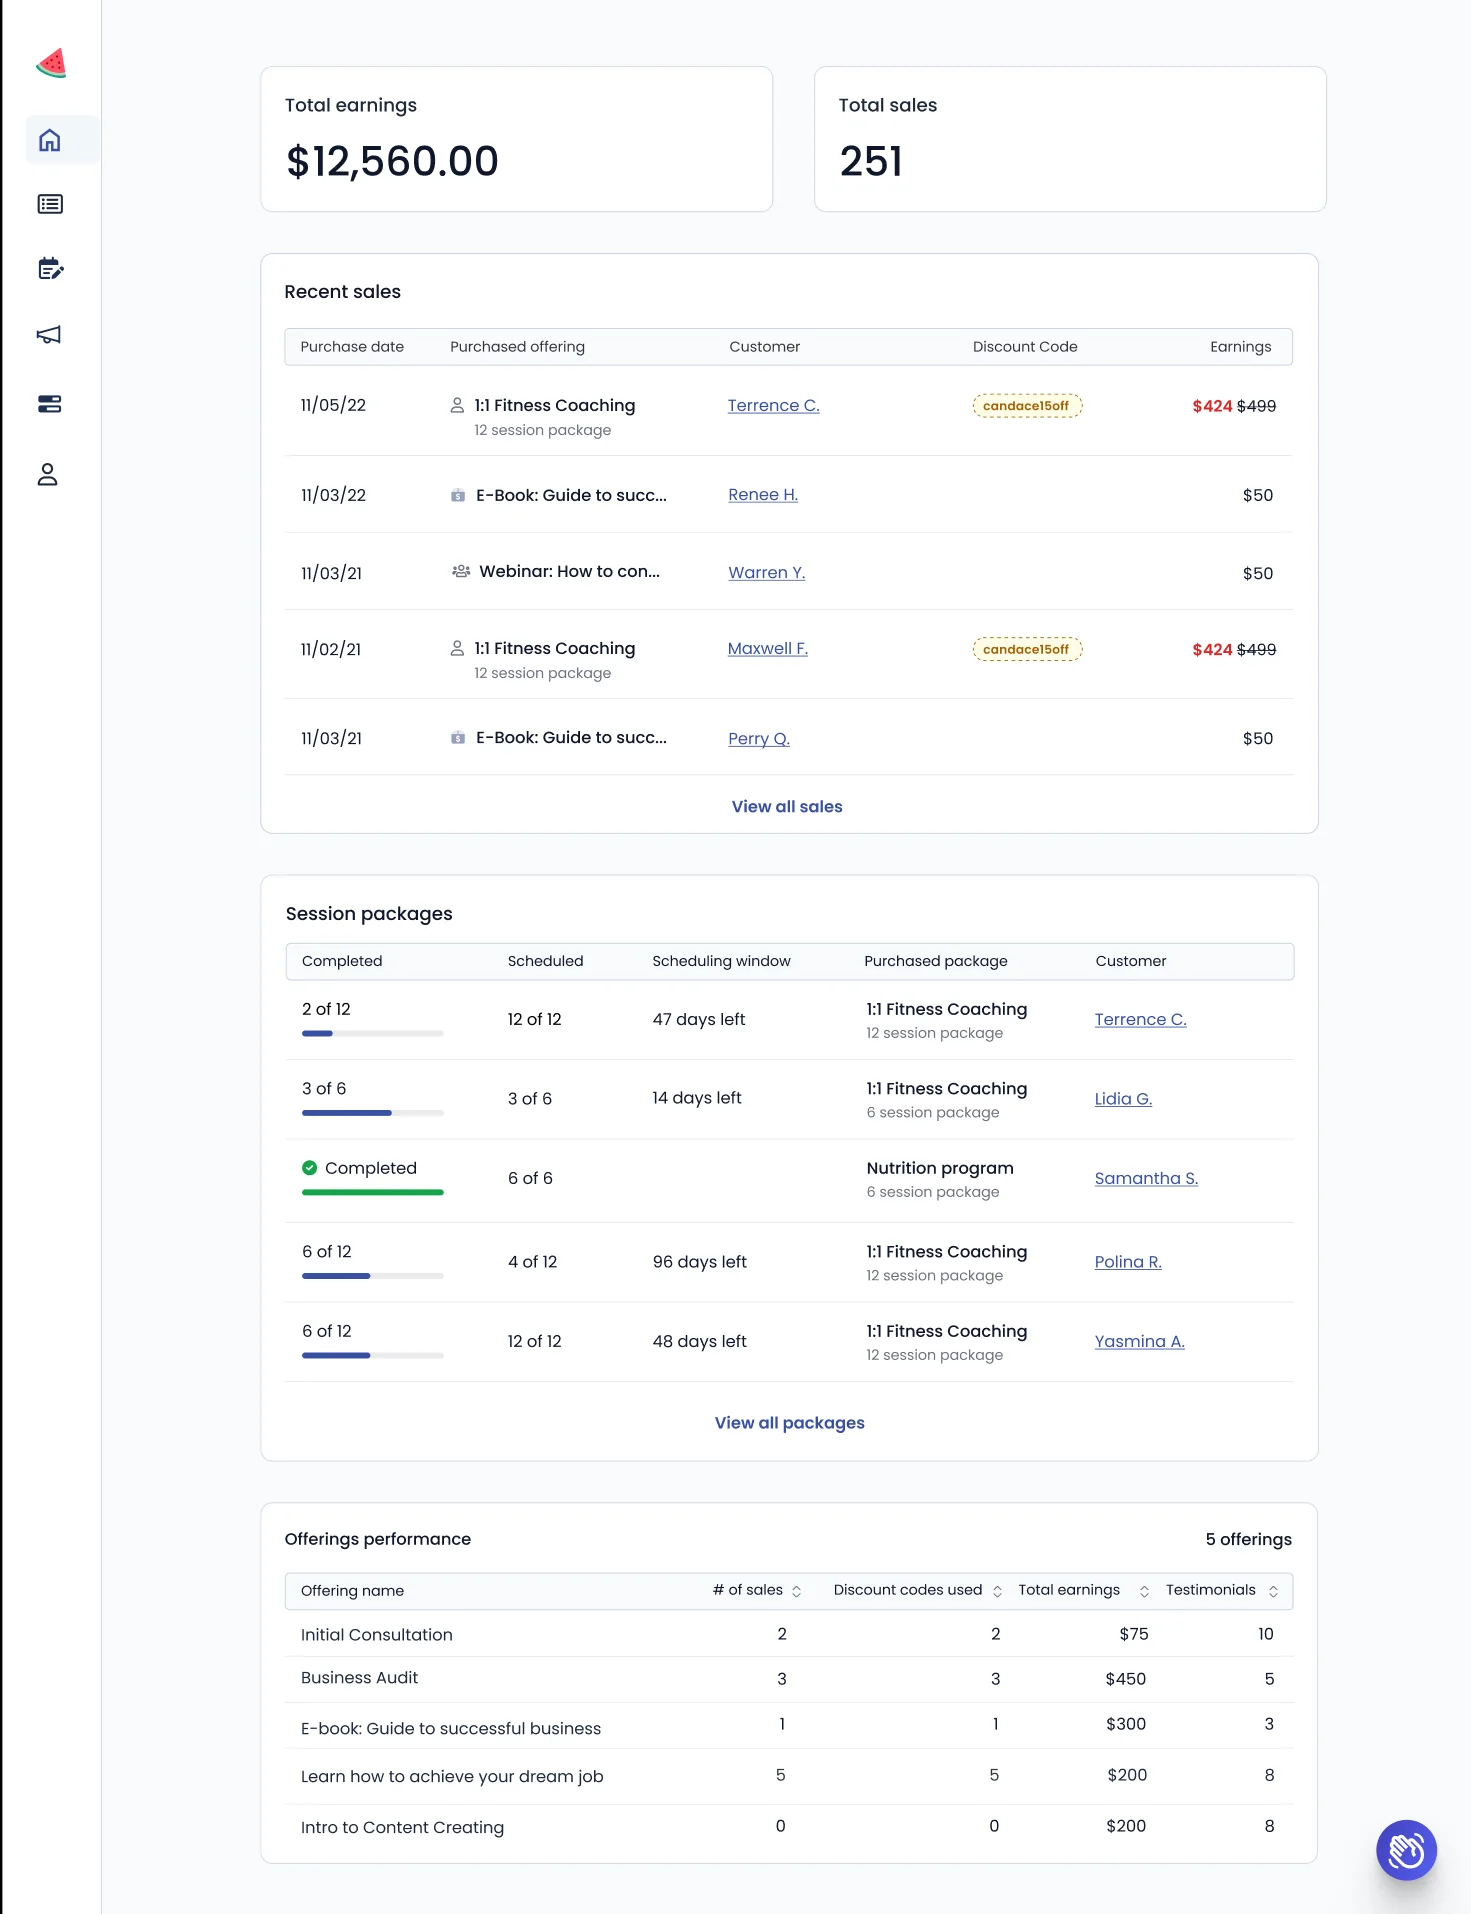
We decided to trim down a few components as it required more engineering effort and we were unsure of the cost-benefit they’d offer. I simplified the elements down to the most important ones that would provide our users prominent value: Total earnings and bookings, page views, and event performance. The plan was to release an initial milestone of the dashboard and determine from user feedback and behavior for future improvements.

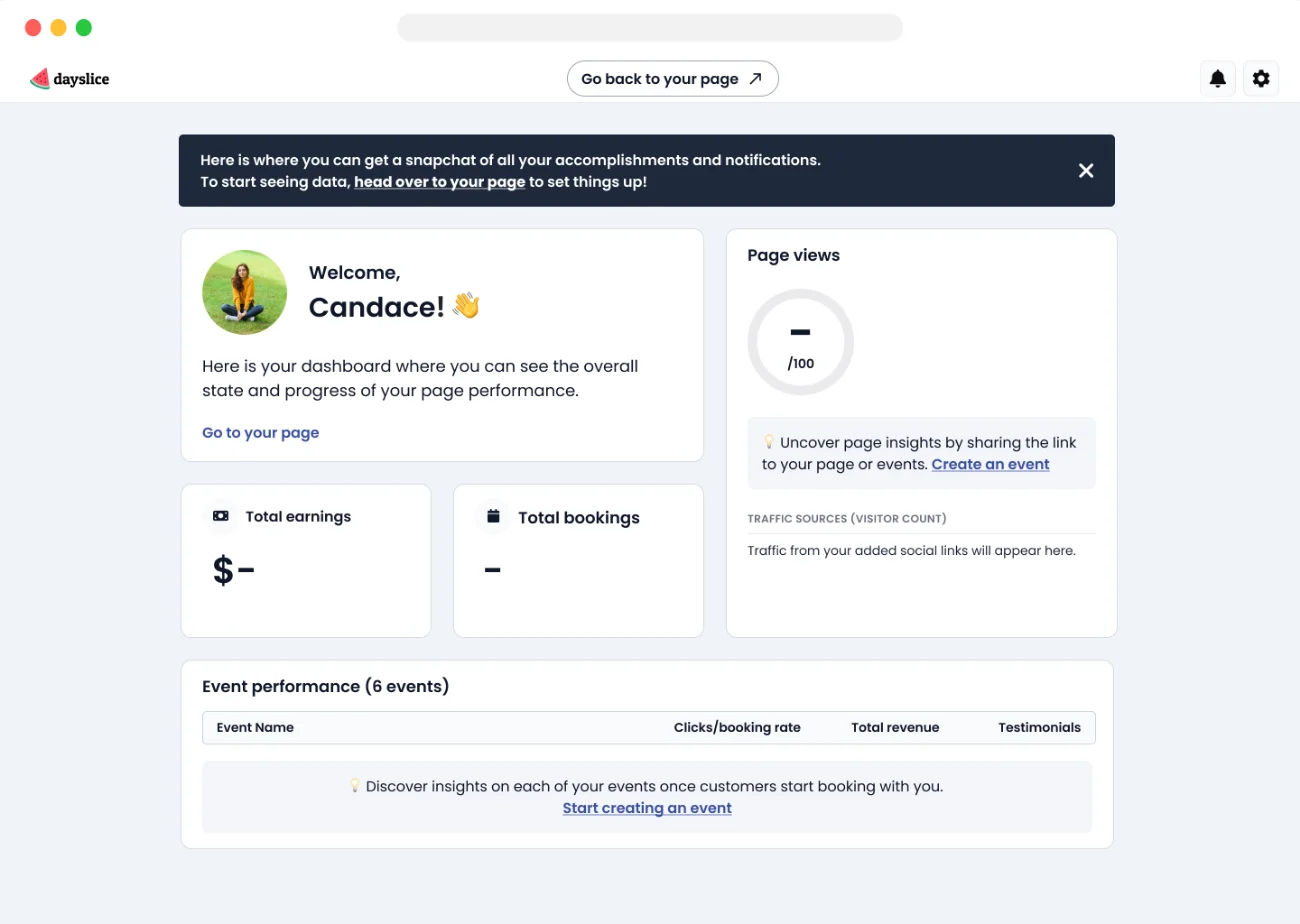
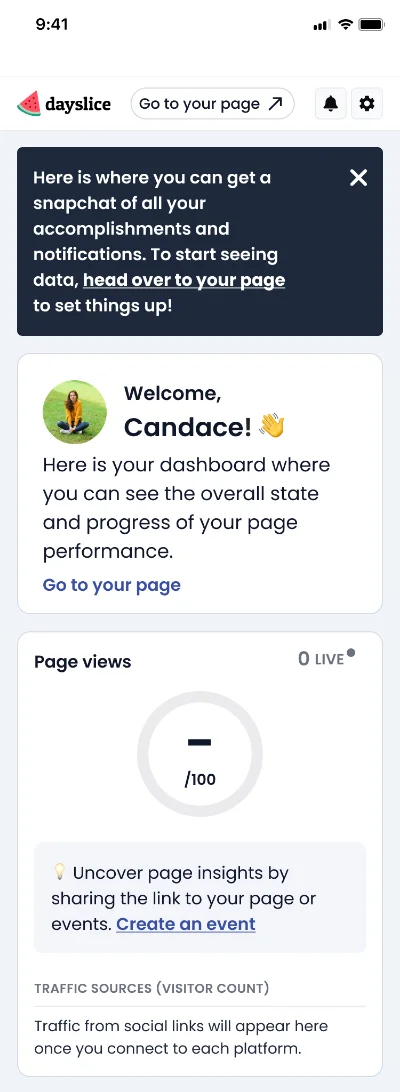
New User State (pre-revenue)

New user dashboard, desktopNew user dashboard, mobile

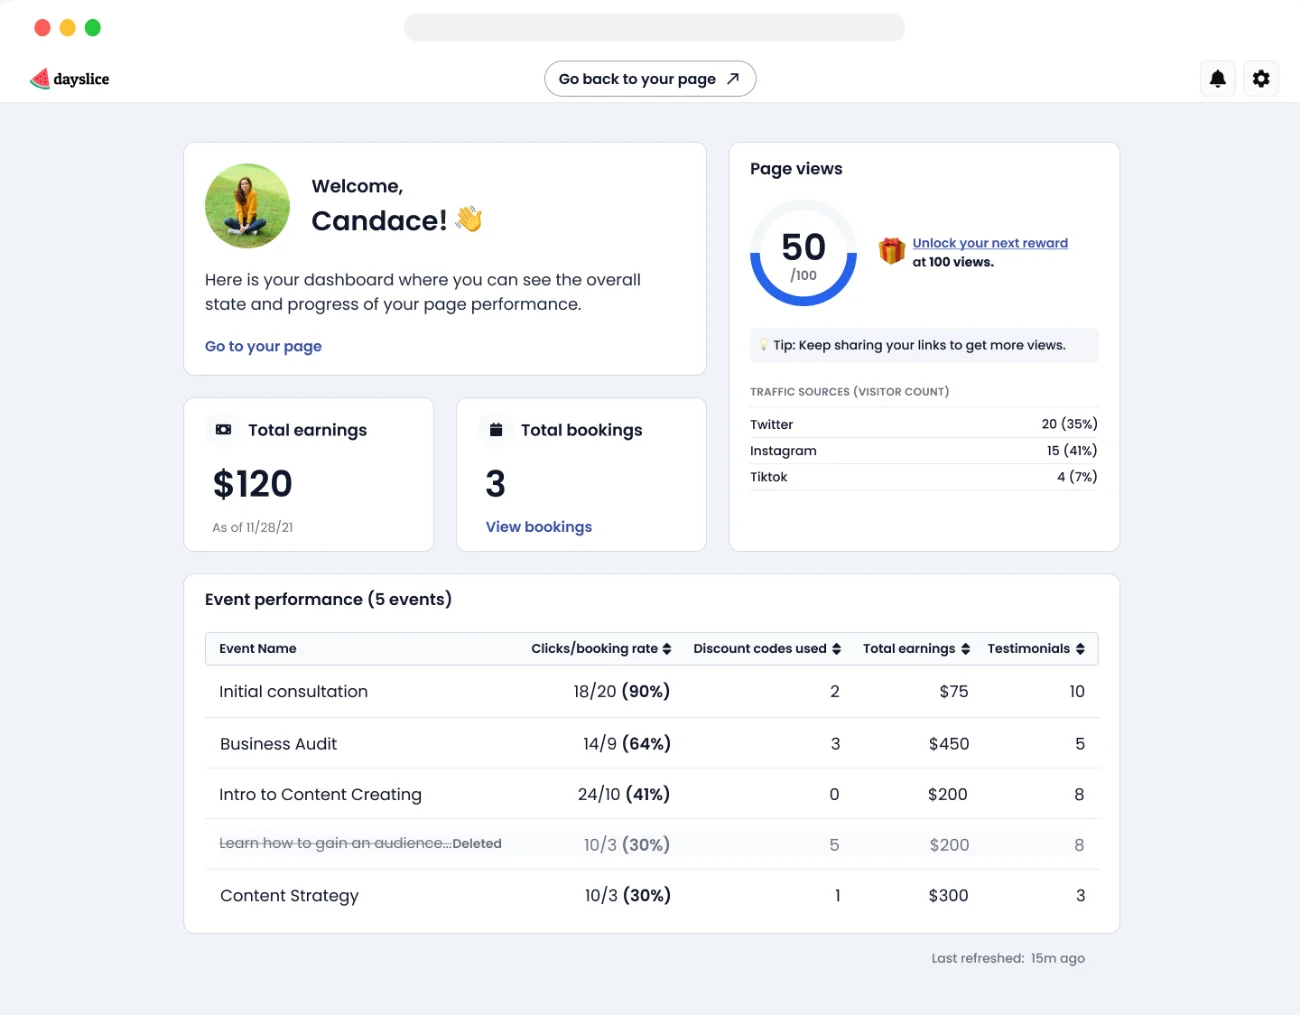
Recurring User State (post-revenue)

Recurring user dashboard, desktopRecurring user dashboard, mobile

Updated dashboard as of June 2023

The updated dashboard as of June 2023
The impact

User retention and engagement rates increased by at least 20%

We saw more users come back to the product more often to engage with their dashboard insights. This proved to be a necessary and useful addition to our users’ workflow.

Reflection

Relying on best practices and existing data

At the time, we hadn’t grown our position as a well-established SaaS product yet, so we lacked the user numbers and relationships for research and testing specifically for this feature. In order to design this solution, I relied heavily on external research and general feedback users had mentioned to our Customer Success teammate. Because we had a tool that tracked user actions and behaviors (LogRocket), it was my primary resource for gauging the success of our feature design.

No specific measures of success

Though we were able to see the feature drive engagement through LogRocket, we did not track precise metrics to evaluate how successful the feature was.

Next time, I’d…

Be more proactive in seeking out users for research and advocating for the process more strategically with my team. The design may have been more accurate in terms of achieving user expectations and determining the necessary improvements.

Thanks for viewing!

View my other work

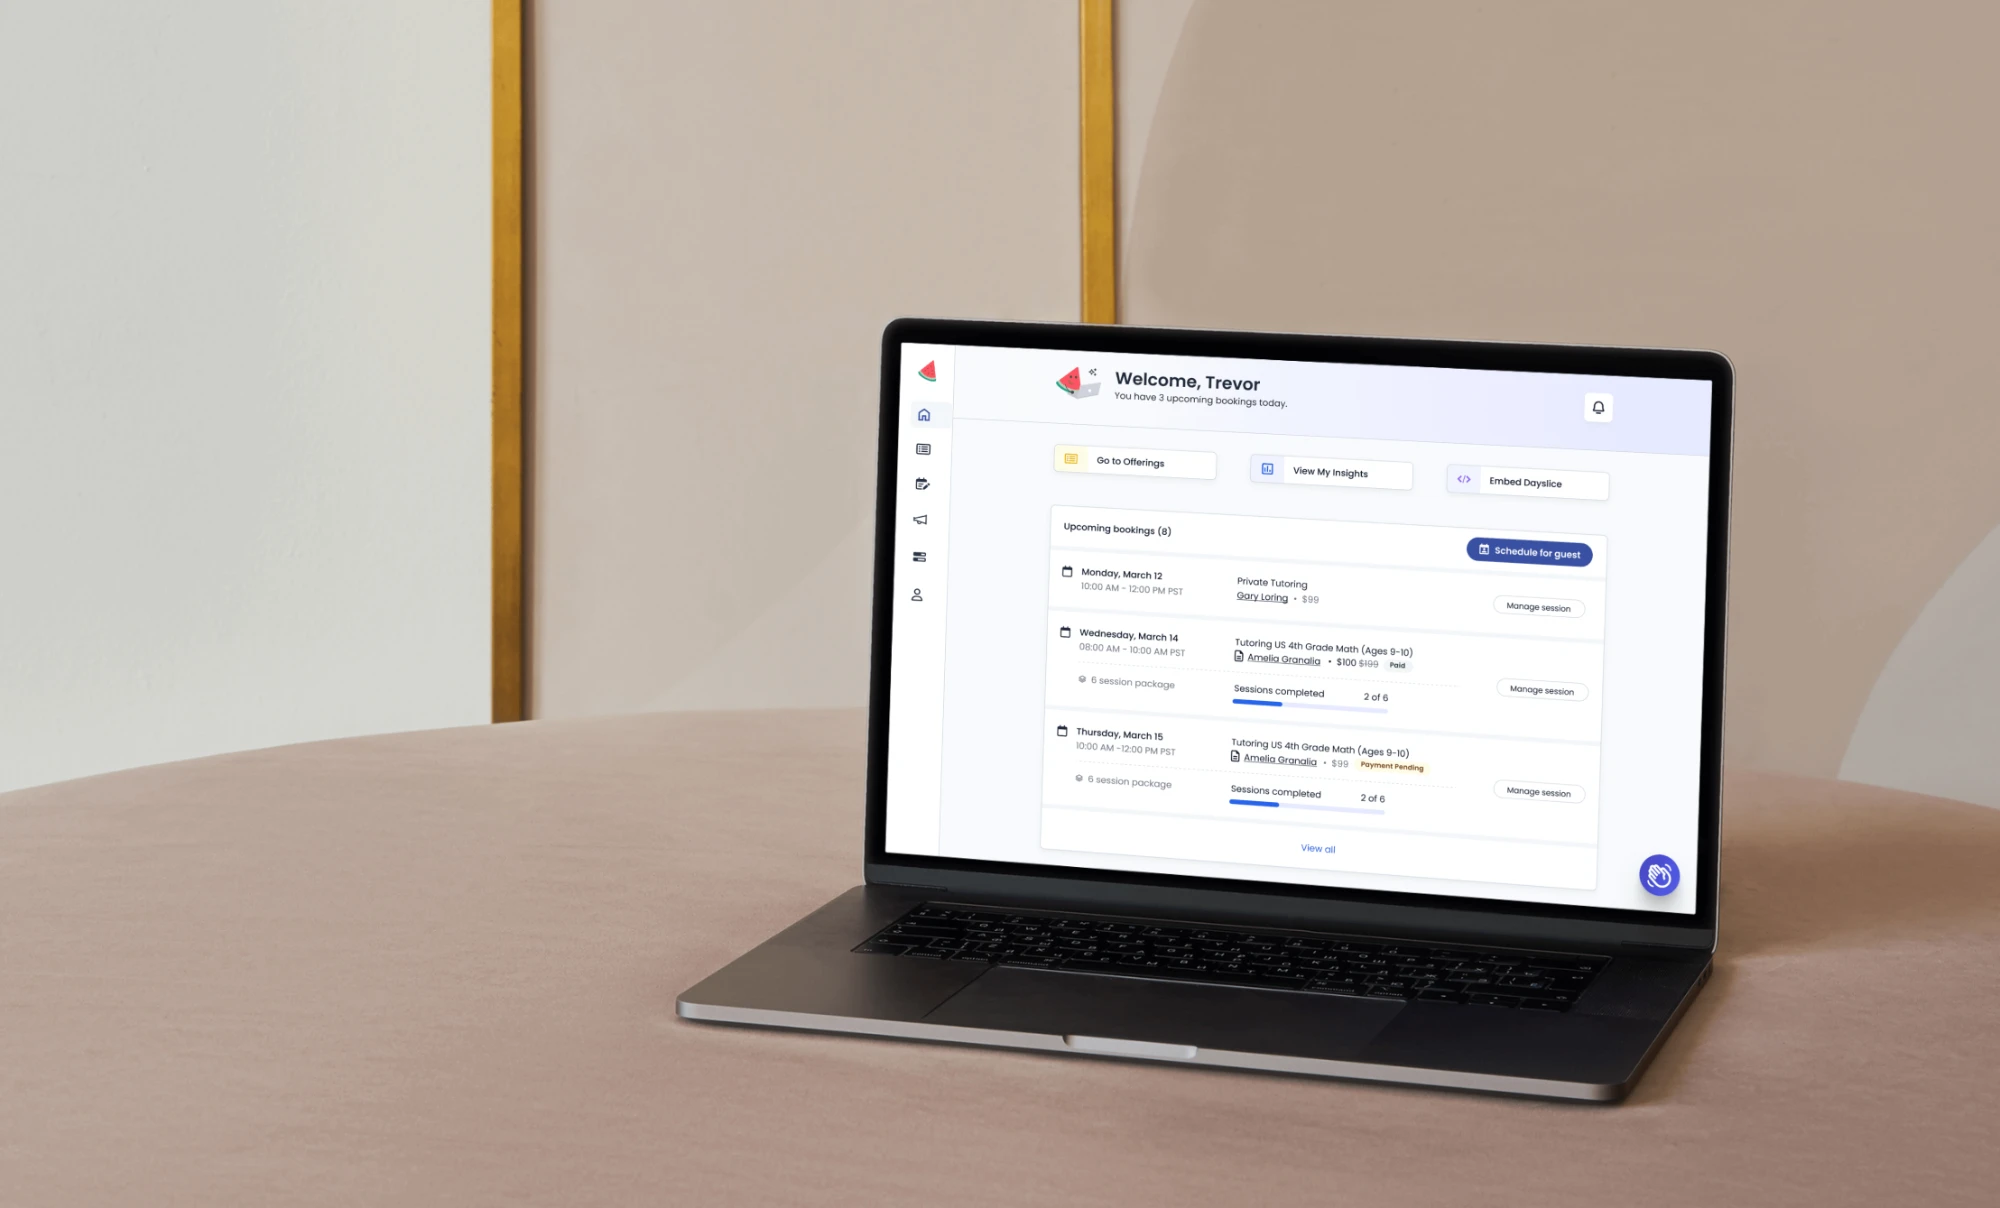
Dayslice in-app homepage shown on a laptop

Redesigning the in-app homepage →